Immersive Analytics

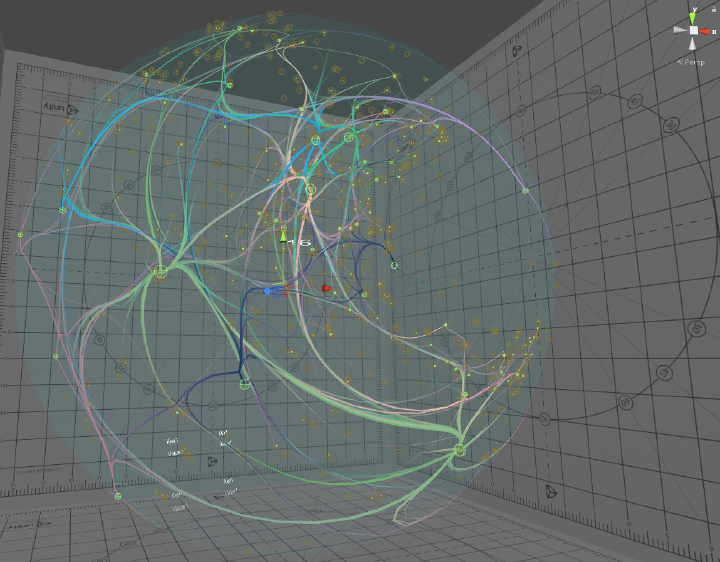
This work aims to develop new methods of data exploration and analysis using immersion techniques in 3D environments.
We are particularly interested here in the development of graph visualization techniques to allow:
- an intuitive visualization of the centrality of nodes (in the sense defined in the field of social network analysis by closeness, betweenness, pagerank…)
- the ability to navigate between several levels of detail (from the community graph to the communities themselves)
This work is based on the ongoing thesis work of Piriziwè Kobina.
Publications
(2022).
Human-centered Evaluation of 3D Radial Layouts for Centrality Visualization.
In WSCG 2022 30. International Conference in Central Europe on Computer Graphics, Visualization and Computer Vision, Pilsen, Czech Republic.
(2020).
3D radial layout for centrality visualization in graphs .
In Salento AVR 2020, 7th International Conference on Augmented Reality, Virtual Reality and Computer Graphics, Lecce, Italy.
(2020).
Layout radial 3D pour la visualisation de la centralité dans les graphes.
In Atelier EGC-VIF 2020, Conférence Extraction et Gestion des connaissances , Bruxelles, Belgique.
(2018).
Visualisation Immersive de Graphes en 3D pour explorer des graphes de communautés.
In Conférence Extraction et Gestion des Connaissances, Atelier Visualisation d’informations, Interactions et Fouille de données, Grenoble.